Asymmetry of Economic Time Series
Literature Survey 1825 - 1993
This survey was carried out for its own sake, but also on behalf of - and with the support of - Sean Holly,
while I was employed as a researcher at the DAE in Cambridge,
and is related to certain early aspects of what is now the
Small UK Model. My
especial thanks go to the
Marshall Librarian at Cambridge University, as it would have been impossible
to compile the data concerning nineteenth century theories without the
exceptional access to rare German and French resources granted me by himself and his staff. Parts of this survey have
appeared in summarised form as part of the paper [Sean Holly & Mike Stannett (1995) "Are there asymmetries
in UK consumption? A time series analysis" Applied Economics 27 pp. 767-72].
A few areas of this survey benefit from access to the font face Symbol. This is a standard Windows font and is also available for other platforms. If you have Symbol available, the following characters should appear to be written in Greek: Sorry - you do not have the Symbol font installed.
| Introduction | References | Sources of asymmetry |
| Business Cycle Theories: 1825-1913 | ||
| Theories from the nineteenth century | Early twentieth century theories | Recent investigations (as at 1993) |
Introduction
Asymmetry
refers to the apparent changes that occur
in the correlation properties of major economic time series as we move through
different phases of the business cycle. Accordingly, any complete investigation
of asymmetry requires some discussion of the causes of business cycles
themselves: can feasible causes of asymmetry be discerned in the mechanisms of
the cycle, and if so, can we use this information to help in the construction of
sensible models? We begin this survey with a brief description of the rise of
business cycle theory, from its origins in the economic crises of 1825 until the
publication of Mitchell's extensive work on the topic in 1913, by which time the
area had essentially crystallised into its current form. Of course, work in the
area has continued throughout the twentieth century, and recent years have seen
asymmetry regarded as one of a number of possible nonlinearities inherent in
economic series. We conclude by reviewing a number of more recent econometric
papers investigating both asymmetry and series nonlinearity.
A popular quote introducing recent papers on nonlinearities in economic times series is taken from Keynes (1936:314),
- There is, however, another characteristic of what we call the trade cycle
which our explanation must cover if it is to be adequate; namely the
phenomenon of the crisis - the fact that the substitution of a downward
for an upward tendency often takes place suddenly and violently, whereas there
is, as a rule, no such sharp turning-point when an upward is substituted for a
downward tendency.
I. Business Cycle Theories: 1825-1913
Theories from the nineteenth century
The theory of business cycles appears to have arisen with contemporary discussions of the economic crisis of 1825 [Mitchell (1913)], and many of the arguments raised at this time are still aired in today's journals. The intensity of discussion was such that the topic developed rapidly, and by the end of the nineteenth century histories of the theory of crises began to appear [von Bergmann (1895); Jones (1900); Lescure (1907:433-522)].
Many conflicting theories arose as to the cause of economic crises. We discuss them briefly here, and will consider their implications for the asymmetry debate below.
External shocks
An appealingly simple explanation of 'crises' is that they are in some sense abnormal departures from underlying economic order, caused by unforeseen (and unforeseeable) one-off events. These might include, for example, the introduction of revolutionary inventions, alterations in trade routes following the development of new means of transportation, wars, the revision of tariffs, fluctuations in monetary standards, crop failures, unexpected bankruptcy of significant enterprises, or even a simple change in fashion. While this theory has its appeal in a basic assumption of underlying order, Mitchell reminds us that such explanations "proceed upon the assumption that the equilibrium of economic activities has become so delicate that it may be disturbed by untoward conjunctures of the most dissimilar kinds, and point to the conclusion that each crisis has its own special cause which must be sought among the events of the immediately preceding years". In a sense, then, this is a 'non-theory' - crises have no general cause.Inflation
A theory also arose which ascribes crises to (perhaps sudden) inflation, prompted, for example, by increased coinage, bank-notes, or deposit currency. As prices rise, it is argued, business is stimulated to increase production; at the extremes, there is a general increase in the prevalence of reckless investments and speculation, which results inevitably in a credit crash and widespread bankruptcy.Over-production and under-consumption
Here, the emphasis is on the propensity of modern means of production which, it was argued, had developed to a point where society could produce more than it could consume. During periods of general over-production, producers would be unable to sell their goods profitably, and would be forced to close factories and shed labour - thereby reducing still further society's ability to consume.Inappropriate production
Classical economists rejected the possibility of general over-production, arguing that supply of goods in one sector necessarily induces demand in others. They argued, instead, that crises arose when unwise investment adhered to inappropriate production; as rates of return fell, so the tendency to embark on potentially high-return, but realistically ill-considered, schemes would rise. This leads in turn to the production of goods for which no market can be found, and the increasing number of business collapses generate a general loss of business confidence, thereby inducing a crisis.Capitalism
A number of theorists accepted the argument of inappropriate production, but added that it was a structural feature inherent in modern capitalism. One group argued that crises arose as a result of the complexity of modern capitalist production, which required manufacturers to produce goods many months in advance for an uncertain market, and investors to commit funds many years in advance for ventures whose necessity is undecidable. Accordingly, capitalistic production precludes the possibility of co-ordinated supply and demand. Rodbertus and Marx went further, arguing that workers necessarily receive less in wages than the real value of their production. Since they formed the backbone of consumer demand, consumption could not hope to keep pace with increasing production. Concurrently, however, capitalist employers would seek to maintain returns by investing in further productive capacity. Under such a system, crises were deemed inevitable.
Early twentieth century theories
By 1900, a certain confluence of opinion had emerged. Crises occurred too regularly to be seen as abnormal catastrophes in an otherwise orderly economy; instead, they came to be seen as part of a three-phase business cycle, encompassing prosperity, crisis, and depression. The emphasis moved, therefore, from one on explaining crises, to one on explaining the cycle itself. Viewed from the perspective of nineteenth century theory, this change has important consequences; if crises are to be seen as part of the normal course of events, we must reject the view that they are the consequence simply of abnormal events which temporarily confuse decision making. Instead, explanations were sought which explained the necessity of crisis in terms of economic organisation. There was no shortage of candidate theories.
Market glutting
Several theories ascribed the cycle to the periodic glutting of markets, but differed as to the mechanisms which might cause such imbalances between demand and supply.May (1902) observed that continued growth in production required steadily rising wages accompanied by falling prices, since otherwise markets could not grow sufficiently quickly to enable production to be cleared promptly. Traditionally, however, times of prosperity have been times of rising prices, so that this condition for continuous growth is violated. A glut occurs, and prices are forced down until the markets can clear. An alternative explanation was proposed by Beveridge (1912), who argued that business cycles result from "the simple and well nigh universal fact of industrial competition"; it is in the nature of a competitive economy that when potential demand is seen not to be satisfied, several competing producers will seek to fill the gap. Inevitably overproduction occurs, and the goods cannot all be sold at a profit. The crisis now occurs as prices necessarily fall, and depression ensues until demand has once again outstripped supply, when the cycle begins again.
Capital Concentration
Hobson's (1909) theory was of a quite different nature, and concerned the nature of income distribution and the existence of excess incomes. Starting from the premise that the mismatch between consumption and production is functionally related to the savings ratio, he observes that in modern societies a considerable proportion of wealth is concentrated in the hands of a relatively small number of individuals. In prosperous times, the income of these few rises faster than their consumption, and they must save the rest. The outcome for the economy as a whole is an excess of savings, which are then ploughed back into production, thereby exacerbating the problem still further. Eventually, the glut occurs, and the drop in prices reduces the income of the wealthy until savings are once again appropriate for balanced consumption.Bouniatian (1908) suggested a similar theory, based on the notion of over-capitalisation. If prices rise in some market, this will tend to concentrate purchasing power, and eventually capital, in the hands of those who own the goods sold in this market. This greater concentration of capital eventually leads to greater investment in related production, and so concentrates purchasing power in the hands of those who control the means of production. Thus, no matter which market initiates price rises, capital will eventually accumulate in those industries which produce industrial equipment. But this reduces the capital available for general consumption, so that the growth of productive capacity outstrips the growth of potential consumption, and prices must fall, thereby dispersing capital once more. Meanwhile, investment demand falls, and the rate of interest is driven down. Eventually, therefore, the restoration of balanced demand is achieved, at the same time that low cost loans are available for new investment in productive capacity. Any price rise in any sector now triggers the cycle to start again.
Diminishing Utilities
Classical economists often rejected the possibility of general over-production on the grounds that human desire is insatiable. Aftalion (1909) sought to show that this objection was unfounded by considering marginal social utilities, and the nature of the production process. While general human desire may be insatiable, the marginal utility of existing concrete goods will, in general, change in response to changes in consumption. Suppose, then, that there exists unsatisfied demand for consumer goods. Producers will set about the construction of new plant, or the design of new lines, so as to meet this excess demand. But this process may take considerable time, during which the marginal utility of existing goods is high, and prices rise. Eventually, however, the new facilities come on line. Now, while general human desire may be insatiable, the marginal utility of existing concrete goods will fall as consumption increases; by enabling increased consumption, new production induces a general fall in the marginal utility of all consumer goods, and a fall in prices. However, the new plant is durable, so that even during the depression production continues, and a state of general over-production ensues. Producers respond by curtailing investment in new plant to the extent where depreciation causes productive capacity to fall. Eventually, excess demand recurs, marginal utilities rise again, and the cycle is triggered once more.Unbalanced Production
Rather than focussing on the distribution of purchasing power, some theorists explained cycles by looking at the distribution of production. In a series of articles [Jahrbuch für Gesetzgebung, 1902, pp. 721-759; 1903, pp. 679-708; 1909, pp. 445-467, 927-951, 1417-1437], Spiethoff explained cycles in terms of a lack of balance between the production of industrial equipment and that of complementary goods. Although Spiethoff acknowledges that the growth in any area eventually leads to growth in those industries which produce industrial equipment, he points out that this new demand can usually be satisfied in a matter of only a few years. The subsequent unemployment among workers, and losses among capitalists, reduce consumer demand, and drag down the consumer market. Eventually, weaker producers are forced out, prices are once more low, new needs develop, and the cycle is repeated. A similar theory was advanced by Hull (1911), but based on changing costs of construction of non-necessary goods. Other theories were also advanced; for example, Sombart suggested that the relevant discrepancy was between organic and inorganic production.Prospective profits
Another school of thought focussed on the mechanism of prospective profits. Lescure argued that as expanding production satisfied the more compelling consumer wants, so prospective profits would fall to the extent that loans would not be forthcoming for the new enterprises necessary to maintain expansion. The demand for producer goods would be choked off, and depression would ensue. As it continued, however, so raw materials, loans, and wages would become cheaper, and costs would be further reduced by the increased emphasis on finding cheaper modes of construction. Similarly, Veblen (1904) focussed on changing discrepancies between current capitalisation of plant and expected earnings, but differed from most analysts in that he regards depression as the normal state of affairs: each bout of prosperity is seen to be induced by exceptional circumstances, and the economy soon returns to its natural state.Unbalanced volatility
Carver (1903) notes that the value of a producer good is the expected sum of its prospective profits, and that a relatively small change in the value of consumer goods produced can change this capitalisation value considerably. It follows that the price of producer goods is considerably more volatile than that of consumer goods. Small increases in the price of consumer goods stimulate large price changes in the associated production equipment, which then draw investment away from consumer goods themselves, thereby raising the price of consumption still further. Eventually, however, the equipment starts to produce sufficient consumer goods to reduce their price. But now, the value of producer goods falls strongly, general price reduction is reinforced, and the process is reversed.Slow adjustment of interest rates
Fisher (1911) suggested another mechanism, based on an observed tendency for rises in interest rates to lag behind those in inflation. During such periods, borrowers (mainly "active business men, precisely the class of greatest foresight") tend to benefit at the expense of lenders, and seize the opportunity to invest. As rises in bank borrowing combine with increasingly rapid money circulation, so prices rise more strongly, and the process reinforces itself. Eventually, however, interest rates catch up, and the demand for loans is reduced, and businesses which had assumed that future expansion would be on much the same terms as before start to crash. As loans contract and businesses fold, so the circulation of money slows, and prices fall, but once again interest rate changes lag behind, and profits are squeezed still further, until interest rates eventually come back into balance and the process can begin again.Sources of asymmetry
There are clearly a number of common threads running through most of these theories. First, we see a concern with the distribution of capital and incomes, and the relationship between these distributions and potential mismatches between the growth of supply and demand. Second, we see much emphasis being placed on the identification of a specific industrial sector - in this case producers of industrial equipment - whose fortunes are deemed to reflect, or even drive, those of the economy at large. The economic relationship between this sector and others within the economy are then seen as paramount to an understanding of the cycle as a whole. This is, perhaps, not surprising given the context in which authors were writing - a context in which progress in the development of machinery was seen as the ultimate force driving economic expansion.
It is not immediately clear that the mechanisms proposed would necessarily, of themselves, result in asymmetry. While it is natural to concern ourselves with the transition from prosperity to depression, we may ask whether the corresponding transition back to prosperity might not simply reflect the dynamics of the crisis in reverse. One explanation of asymmetry is particularly simple. Clearly, during a crisis, the first to suffer are the reckless. The existence of regular crises therefore serves to increase the proportion of cautious individuals and organisations involved in business. But it is in the nature of caution to avoid risks as soon as they are evident, and to proceed only slowly when fortunes appear once more to be picking up. Accordingly, it is to be expected that the withdrawal of economic activity that accompanies a crisis should occur more readily than the reinvestment that accompanies the transition from depression to prosperity.
Another possibility is that asymmetry is introduced by asymmetries in the information available to participants market mechanisms. Gul & Postlewaite (1992) consider the cumulative effects of asymmetric information in large exchang economies. They observe that asymmetry of information is probably characteristic of economic situations, since agents usually have information about their own utility functions which are not known to all other agents. In order to move from microlevel information to macromodels, it is necessary to assume that the informational relevance of each agent is small - the advantages that accrue to them from possessing non-common knowledge are assumed to be insignificant to the economy as a whole. They explain, however, that while this is an attractive notion, it suffers both at a technical and a practical level. First, it may be that, far from cancelling each other out, the effects of informational asymmetry at the agent level accumulate when we aggregate to the economy as a whole. And secondly, it is far from obvious how the 'informational smallness' of an agent may be established empirically. Gul & Postlewaite consider conditions under which asymmetries will necessarily cancel out, and point out that situations exist when their effects are indeed cumulative. Indeed, Akerlof (1970) demonstrated a model economy in which a large number of identical agents had private information about a car they wished to sell. Although each agent is intuitively 'informationally small' the market outcome was not as it would have been had the asymmetry not existed.
Burgess (1992) suggests another mechanism centred on the nature of search costs involved in locating a trading partner. "In the nature of matching models, this will depend on the 'tightness' of the market for [their good] x, and hence on the amount of x traded. So the adjustment costs and hence the speed of adjustment of x will depend on the tightness of the market for x. This gives rise to nonlinear dynamics ... [such that] in the downswing x chases a falling target quite rapidly, while in the upswing it chases a rising target more slowly".
II. Recent Econometric Investigations (at 1993)
Although there has clearly been much interest in the business cycle, the analytical investigation of general asymmetries in the economy appears to have begun only recently, the first papers coinciding to some extent with a general explosion of interest in nonlinearity theory in the early 1980s.
Neftçi (1984)
It is convenient to take as our starting point Neftçi's (1984) paper in which he investigates whether economic time series might be asymmetric over the business cycle.
Neftçi argues that it is inappropriate to test for asymmetry by splitting data into two groups - one representing contractions, the other expansions - and then performing separate analyses upon the two sets of data to determine whether significant dynamic differences in structure can be identified. Such a procedure, he argues, will bias the results in favour of asymmetry. Accordingly, he rejects the use of such strategies, and suggests instead that the statistical theory of finite-state Markov processes should be used.
Specifically, suppose that {Xt} is some series of interest. Let {It} be the indicator function defined by
so that {It} is generally positive during upswings in {Xt}, and generally negative during downswings. The behaviour of {It} can be exploited to determine whether {Xt} is asymmetric. For example, if downswings are sharp, but upswings gradual, we would expect to find that {It} stays in the state +1 longer than it stays in the state -1, i.e. the transition probability associated with moves +1 ---> +1 are greater than those associated with moves -1---> -1. Let l11 denote the probability that It will equal +1 if both It-1 and It-2 equal +1. Let l00 denote the probability that It will equal -1 if both It-1 and It-2 equal -1. If {Xt} is symmetric, we should have l00 = l11. If ST is some realisation of {It}, the corresponding log-likelihood function is
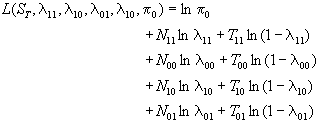
where
- p0 is the probability of the initial state
- l10 = P { It= +1 | It-1 = +1 and It-2 = -1 }
- l01 = P { It= -1 | It-1 = -1 and It-2 = +1 }
- the parameters Nij and Tij denote the number of occurrences of the states implied by the associated transition probabilities.
Once the l's have been estimated by maximising the log-likelihood function, a confidence ellipse for l00 and l11 can be constructed by solving the quadratic equation
where
![lambda-bar = [ lambda-00, lambda-11 ]](asym_LambdaBarDefined.gif)
- H is the 2×2 matrix of second partial derivatives of L with
respect to l00 and l11 evaluated at

- a is the desired confidence level
We reject the hypothesis of asymmetry (i.e. l11 > l00 for a procyclical variable) if any part of this ellipse falls on or below the 45° line, with l00 measured on the horizontal axis.
Neftçi applied this techniques to three US unemployment rate series: the seasonally adjusted rate, the rate for 15 weeks and over, and the rate for insured workers. In each case, he found that the diagonal remained outside the 80% confidence ellipse.
Falk (1986)
Subsequently, Falk (1986) applied Neftçi's methods in an analysis of the behaviour of real GNP, investment, and productivity in the US, as well as non-US industrial production. He found the claim for asymmetry to be uncompelling: the null hypothesis that recessions in GNP and investment do not tend to last as long as recoveries was rejected at the 80% confidence level. In no case did he find evidence in support of the asymmetry thesis.
Sichel (1989)
Sichel (1989) attempted to replicate Neftçi's results, using data from the same sources, and discovered a probable error in Neftçi's empirical work that reverses the significance of his evidence for the asymmetry of the unemployment rate. On calculating the confidence ellipse, Sichel obtained confidence levels below the 80% levels cited by Neftçi. However, he notes (p. 1259)
Given the potential sensitivity to noise or measurement error, it is interesting to note that there is some evidence of asymmetry in annual data in which, presumably, more of the noise is averaged out. In particular, there is strong evidence of asymmetry in annual unemployment in both a 1949-81 and 1949-87 sample. For example, for 1949:1-1987:4, the quarterly data t-statistic for [ l11-l00=0 ] is 0.88 while the annual data t-statistic is 2.0 ...... the annual data evidence and the power analysis suggest that Neftçi's test applied to quarterly data may not identify asymmetry that is, in fact, present and has been identified by other researchers.
Hamilton (1989)
Despite these shortcomings, Neftçi's work has triggered subsequent promising investigations which continue to suggest the presence of nonlinearities in economic time series data, although it is not always apparent that these nonlinearities are connected with movements through the business cycle. A key paper is that of Hamilton (1989), in which he applies Markov methods to derive a series of useful results under the assumption of switching in the dynamics of series under study.
Suppose that {Xt} is some particular series, which may or may not display non-zero trend. Either way, let {nt} denote the trend component of {Xt}. Then {nt} obeys a Markov trend in levels if
where the a's are constants, and st takes the value 0 or 1, and denotes some unobserved state of the system under observation. The switching variable {st} is assumed to be governed by a first order Markov process of the form
| P{ st = 1 | st-1 = 1 } = p | P{ st = 0 | st-1 = 1 } = 1-p |
| P{ st = 0 | st-1 = 0 } = q | P{ st = 1 | st-1 = 0 } = 1-q |
Hamilton demonstrates that, as one would expect, information about the initial state of the economy has no effect on the long-run growth rate {Dnt}, but a permanent effect on the level {nt}, since
where l = (p+q) - 1.
Since {nt} represents only the trend component of {Xt}, we need to examine combinations of {nt} with other stochastic processes. Hamilton considers the process
where
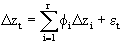
- the fi are constants; and
- the {et} are IID(0,s²) and independent of {nt+j} for all j These
specifications imply a model of the form DXt = a1st + a0 + Dzt,
where
Hamilton provides extensive details (pp 367-71) of how probabilistic inferences about {st} may be drawn from knowledge of {DXt}, on the assumption that {DXt} can be observed, but that this is true for neither {st} nor {Dzt}.
Hamilton applied his technique to US post-war data on real GNP, using
for the period 1951:2 to 1984:4, and found evidence of negative growth (-0.4%) during state 0, and positive growth (+1.2%) during state 1, which he interpreted as indicating true cycles, rather than switches between two positive growth rates. Furthermore, he estimated dates for peaks and troughs for the post-war business cycles, and obtains results in close agreement with NBER estimates.
Hamilton's highly detailed paper concludes with an analysis of the behaviour of consumers, and asks how unanticipated increases to current income affect estimates of permanent income. His results suggest that knowledge of the state of the economy is relevant: "the certain knowledge that the economy has gone into a recession is associated with a 3% drop in permanent income".
Kähler & Marnet (1992)
Hamilton's results are impressive, but his ideas have recently been re-examined by Kähler & Marnet (1992), with surprising results. We may interpret Hamilton's basic model
as suggesting a process which draws from two normal distributions which differ only in their means. In order to allow for more extensive asymmetry, Kähler & Marnet extend Hamilton's model to allow for differing variances as well, and apply his techniques to GDP data for four countries, Canada, the UK, the USA, and West Germany. They find that variance is smaller in recessions than in booms for Canada and West Germany, but smaller in booms for the UK and the USA. But perhaps the most surprising results concern the transition probabilities between booms and recessions, and the expected duration of recessions.
Using Hamilton's original technique, the probability of growth in the next period given growth now is very high: 98.1% for Canada, 95.2% for the UK, 95.7% for the USA, and 93.9% for West Germany. In contrast, the probability of repeated depression was considerably smaller. Accordingly, the associated unconditional probability of recession is (arguably) low: 8.6% for Canada, 18.5% for the UK, 5.8% for the USA, and 12.4% for West Germany. Such results are arguably reasonable for the UK, but Kähler & Marnet note that for the USA the average length of a recession would stand at about 1.5 quarters, in sharp contrast to conventional wisdom that USA recessions have an average duration of some 13 months.
Allowing for changing variances changes these figures considerably. 'Recession' in West Germany becomes something of a misnomer over the sample period, since even in slow-growth periods, that growth is still positive. The unconditional probability of recession in the USA now climbs to 50%, and that for the UK to 60.8%, figures which might in turn be considered unreasonable.
Why does the allowance for changing variance matter appear to have such significant effects, and why do such counter-intuitive results emerge? Kähler & Marnet suggest that Markov-switching models are not picking up level changes in the D's, but rather changes in volatility - an effect which is not allowed for in the unmodified technique. They continue
Is the Markov-switching model wrong? We do not think so. Instead, we would blame the differencing of the data for the failure to identify business cycles. It is apparent ... that there is hardly any persistence in levels of these series and that variance effects are clearly dominant. It is obviously futile to search for business cycle phenomena in GDP data which are differenced since, for these data, differencing is a filter which removes the level effects ... We could show that for the study of business cycle phenomena, the differencing of GDP data has fatal effects. Within the Markov-switching model, which is designed to identify booms and recessions,
we were not able to find meaningful business cycle phenomena if we allow for asymmetries in business cycles.
References
- Aftalion A. 1909 Essai d'une théorie des crises générales et périodiques. Paris.
- Akerlof G. 1970 The market for lemons. Quarterly Journal of Economics 89 pp 488-500.
- Beveridge W.H. 1912 Unemployment (3rd ed). London.
- Bouniatian M. 1908 Studien zur Theorie und Geschichte der Wirtschaftskrisen. Munich.
- Burgess S.M. 1992 Asymmetric employment cycles in Britain: evidence and an explanation. The Economic Journal 102 pp 279-90.
- Carver T.N. 1903 A suggestion for a theory of industrial depressions. Quarterly Journal of Economics (May) pp 497-500.
- Falk B. 1986 Further evidence on the asymmetric behaviour of economic time series over the business cycle. Journal of Political Economy 94 pp 1096-1109.
- Fisher I. 1911 The Purchasing Power of Money. New York.
- Gul F., and Postlewaite A. 1992 Asymptotic efficiency in large exchange economies with asymmetric information. Econometrica 60(6) pp 1273-92.
- Hamilton J.D. 1989 A new approach to the economic analysis of nonstationary time series and the business cycle. Econometrica 57(2) pp 357-84.
- Hobson 1909 The Industrial System. London.
- Hull G.H. 1911 Industrial Depressions. New York.
- Jones E.D. 1900 Economic Crises. New York.
- Kähler J., and Marnet V. 1992 International business cycles and long-run growth: an analysis with Markov-switching and cointegration methods. Recherches Economiques de Louvain 58(3-4) pp 399-417.
- Lescure J. 1907 Des crises générales et périodiques de surproduction. Paris.
- May R.E. 1902 Das Grundgesetz der Wirtschaftskrisen. Berlin.
- Mitchell W.C. 1913 Business Cycles. Berkeley: University of California Press.
- Neftçi S.N. 1984 Are economic time series asymmetric over the business cycle? Journal of Political Economy 92 pp 307-28.
- Sichel D.E. 1989 Are business cycles asymmetric? A correction. Journal of Political Economy 97 pp 1255-60.
- Veblen T.B. 1904 Theory of Business Enterprise. New York.
- von Bergmann E. 1895 Geschichte der nationalökonomischen Krisentheorie. Stuttgart.