
Introduction
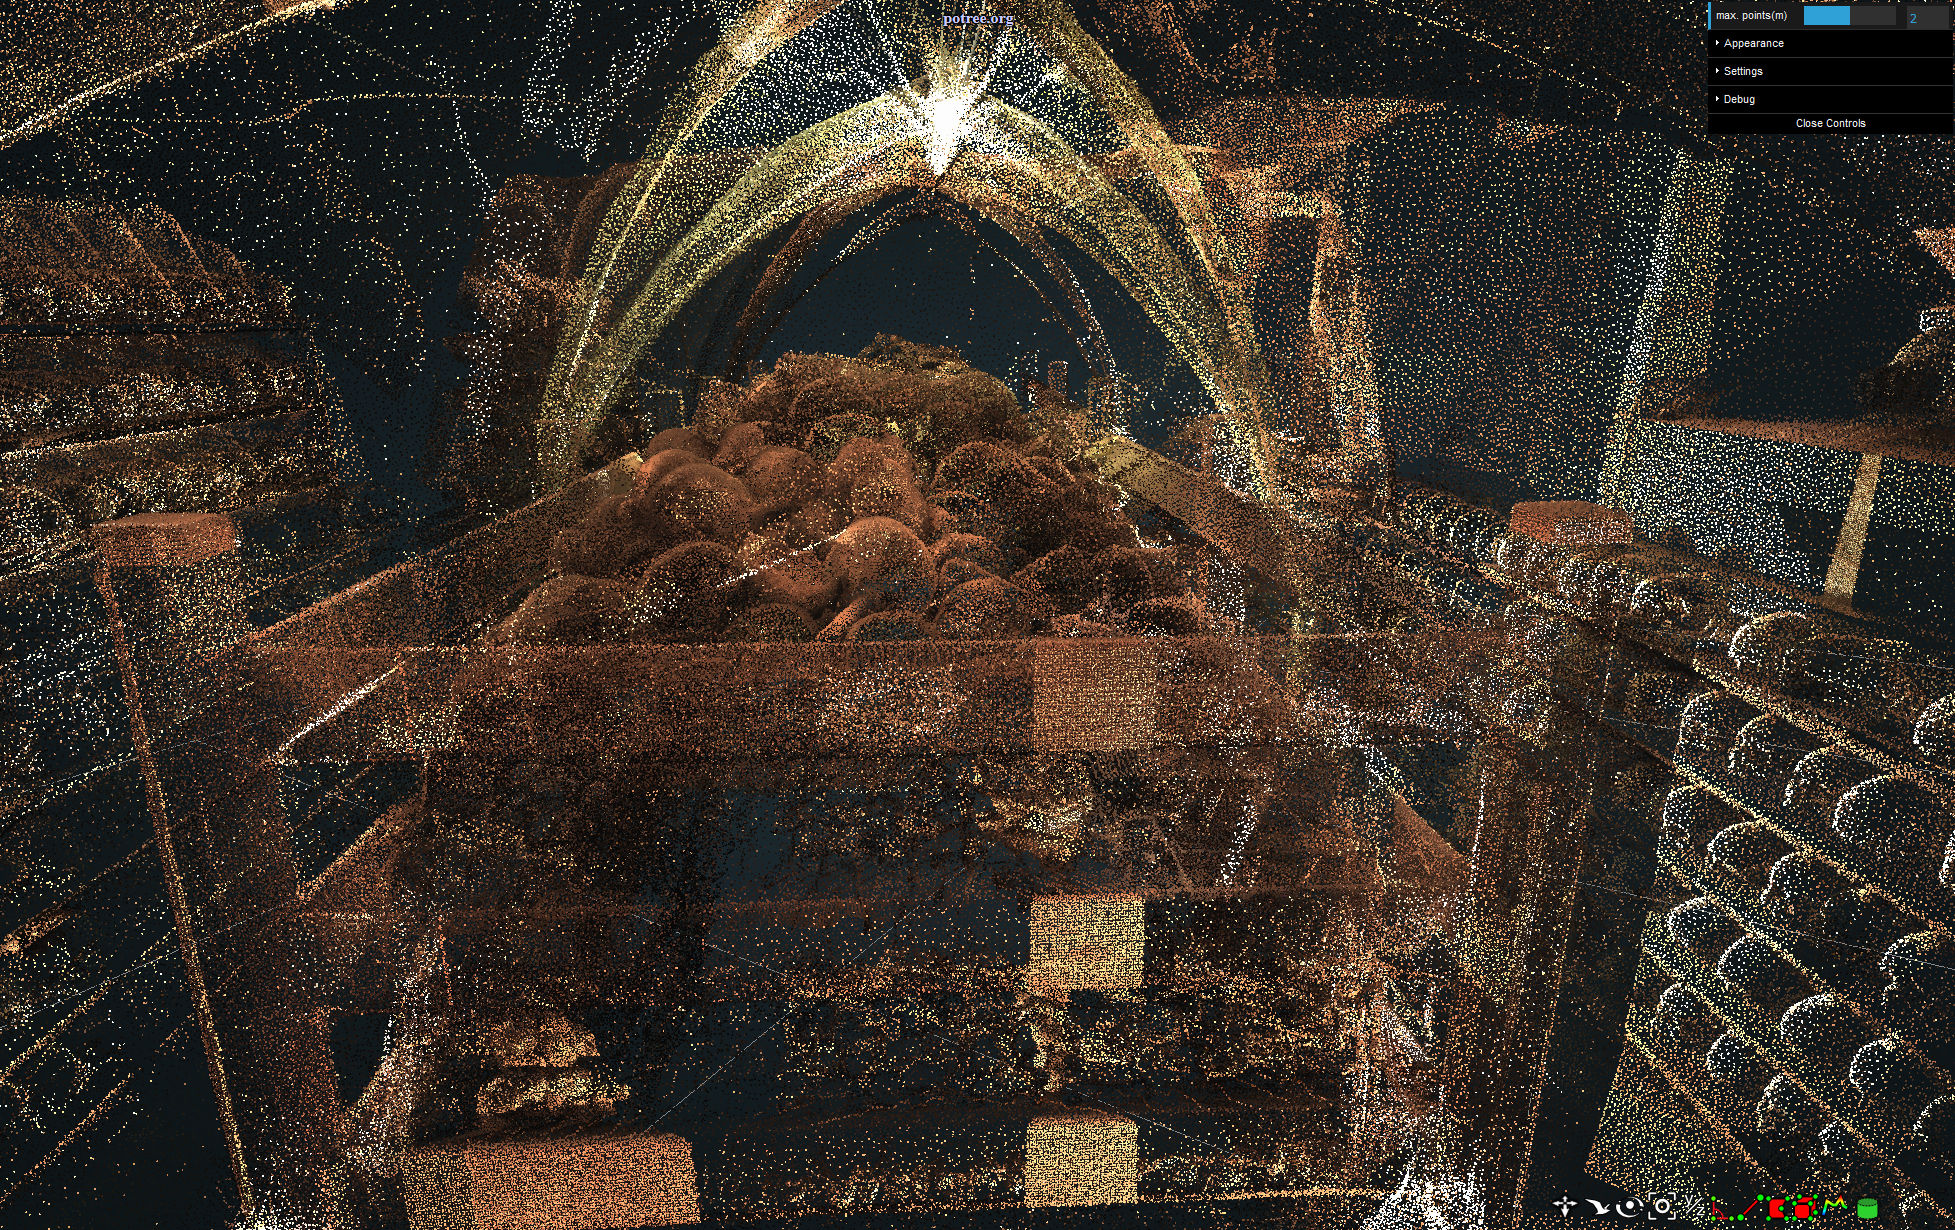
The point cloud for Rothwell Charnel Chapel was captured using a Leica ScanStation P20 3D scanner, producing 60 million points, with the data for each point consisting of an (x,y,z) coordinate and an associated colour value. Free, open source software called potree can be used to visualise and interactively explore the data, as illustrated in Figure 1.
Using the software
Once the software is launched, the arrow keys on the keyboard and the mouse can be used to navigate around the data set. Due to the size of the dataset, a fast Internet connection is required, together with a good desktop computer.
There are a range of parameters that can be altered using the interface in potree. Figure 2 shows the initial menu in the top right hand corner of the screen. The value of 'max points' determines how many of the points in the point cloud are used in the visualisation. Increasing this value displays more points, giving a better impression of the data, but means slower visualisation times. The menu can be expanded to give more parameters that can be altered to change the visualisation.
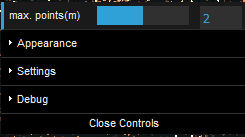

Figure 3 shows the button set at the bottom right of the screen. The first three buttons set movement control to be 'earth controls', 'flight controls' and 'orbit controls', respectively. We have set the default to be 'flight controls', which means that the keyboard and mouse can be used to fly around the point cloud. The fourth button resets the view to a default position. This is less useful as the default is outside the point cloud, which means the user must then navigate into the point cloud. For the Rothwell data the 'outside' view is somewhat misleading, since it is the outside of the inside surface, not the true outside of the stonework used to build the chapel (as the inside is what was scanned). The remaining buttons are not needed for viewing the data - most are concerned with measuring aspects of the data.
Acknowledgements
This website is part of 'The Digital Ossuary' collaborative project, based at The University of Sheffield.
Project team: Elizabeth Craig-Atkins, Dawn Hadley and Jennifer Crangle, Dept. Archaeology; Steve Maddock, Peter Heywood and James Williams, Dept. Computer Science; Rab Scott, Tom Hodgson and Adam Wiles, NAMRC.
Grateful thanks are due to Holy Trinity Church, Rothwell; Rev. Canon John Westwood; The Diocese of Peterborough; the churchwardens and congregation of Holy Trinity; and the people of Rothwell.
The project was funded by the University of Sheffield through the Digital Humanities Exploration Fund and a SURE student placement.
Find out more at: www.rothwellcharnelchapel.group.shef.ac.uk