
Session 4: GUI
Session 1 | Session 2 | Session 3 | Session 4
To get the full benefit of these matlab introduction sessions, try each example in MATLAB.
Also, have you completed Sessions 1, 2 and 3? If not, go back to them first.
Matlab's HTML based help - Help Desk - is an invaluable source of information on both functions from
the matlab core as well as the GUI programming system Handle Graphics. Each time you come across a new
function, look it up in the HTML help. Help Desk can be accessed from the Help menu of the Matlab application.
Introduction
This session is about how to implement your own MATLAB-based Graphical User Interface (GUI) tools.
In the last session, you learned about the use of Callbacks to control the interface events. First of all,
however, you need to create the interface.
In all circumstances, you should create two m-files:
- The GUI description:
myapp_gui.m - The callback file:
myapp.m(see Session 3)
Creating the window
...allows a statement to be split over two lines to aid readability.- The handle to the figure has been stored. This can be useful later. Notice that it is stored in
a structure called
ud.
UserData. This is used to store all your application's
state variables. Whenever a callback is executed, this UserData is loaded and then resaved on completion.
This can be acheived byud=get(gcf,'UserData');set(gcf,'UserData',ud);Recall that
gcf returns the handle of the current figure window.To find out about other properties, look at the Figure section of the Handle Graphics online help.
Creating a set of axes
[left, bottom, width, height]where left and bottom define the distance from the lower-left corner of the screen to the lower-left corner of the figure window. width and height define the dimensions of the window. See the Units property for information on the units used in this specification.
In this case, the Units are normalized units which map the lower-left corner of
the figure window to (0,0) and the upper-right corner to (1.0,1.0). Always use normalized units!
There are many other properties that can be altered if you wish. Take a look at the Axes section of the online Handle Graphics help.
Creating a button
playInput callback in the
myapp switchyard function.
Session Exercise
The aim is to implement a simple GUI with an axis and a push button. When the button is pressed,
a dialog box should appear from which you can choose a sound file. This should then be loaded into
the axes.
- Investigate how to read a .wav file and store it in a variable at the command line.
Hint:
wavread - Create a figure window using the M-File method of invocation. Save your GUI M-File as
myload_gui.m - Create an axis in this figure. (Note: use normalised position coordinates).
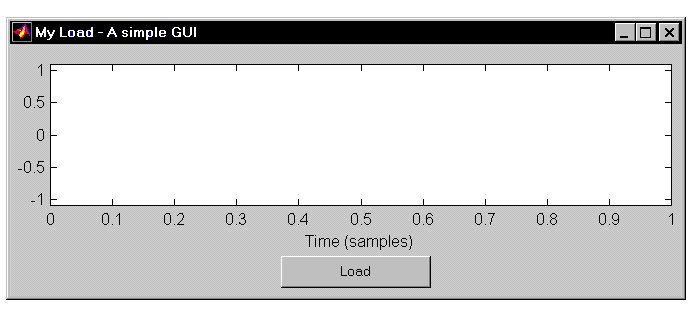
- Create the push button labelled Load. You should have something like:
- Create the
myloadswitchyard M-File. Don't forget to deal with the start-up case of no input arguments. - Code the loading callback. Store the signal and it sampling frequency and bit rate in the UserData.
- Code the plotting operation (this should automatically follow loading the sound file).
- Using a callback for ButtonDownFcn allow the signal to be played when the user clicks on the axes. Does it work when the user clicks on the line? If not, fix this.
- Change the axes limits so that you can have a millisecond scale on the x axis as opposed to a sample scale.
- Move the load operation to a menu.
- Handle stereo inputs.
- Create a new axes and display the spectrogram of the signal.
If you would like me to check your code after the session, you can e-mail me your program and I'll take a look at it.
To get a feel for real life GUI implementation, take look at the MAD package. The code for these is on the network drive and is accessible in Matlab on the NT machines.
Session 1 | Session 2 | Session 3 | Session 4