Speech Separation Demonstration
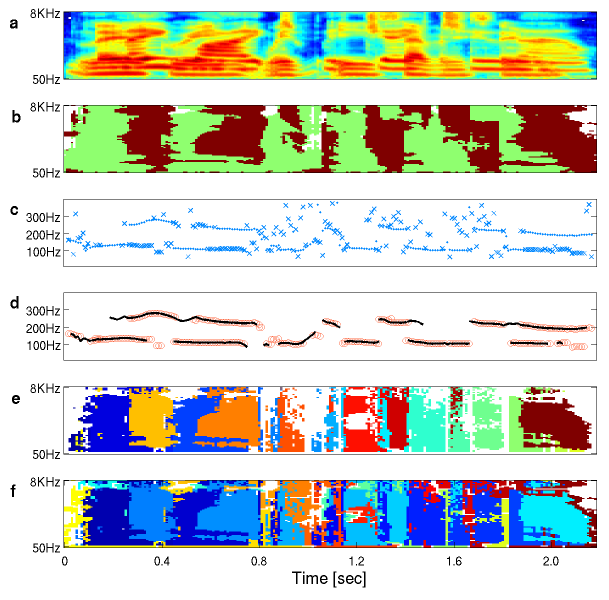
Figure 10. (a) An auditory spectrogram for the mixture of simultaneous speech: ‘lay white with J 2 now’ (target, female) plus ‘lay green with E 7 soon’ (masker, male), target-to-masker ratio = 0 dB. (b) The ‘oracle’ segmentation. Dark brown: pixels where the value in the mixture is close to that in the female speech; light green: the mixture value is close to that in the male speech; white: low energy regions. (c) Pitch estimates for each source segmentation. Dots represent the pitch of the stronger source in each frame and crosses represent the weaker source at that frame. (d) Circles are pitch tracks produced by the multipitch tracking algorithm; solid lines are the ground-truth pitch tracks. (e) Spectro-temporal fragments (regions of energy from individual sources, represented in different colours) based on the estimated multipitch tracks (f) Combining inharmonic fragments.
